Look at Java and CPU caches
Memory hierarchy
Let's look at the cache hierarchy and data access time. The time depends on the hardware and is given to illustrate how many times each memory is faster or slower than the other.
Processor registers
Processor registers have the fastest access (typically 1 processor cycle) and can be as small as a few bytes.
L1 cache
L1 caches (the instruction and data caches) are typically 128 kilobytes in size. Access time is around 0.5 nanoseconds for the data cache and 5 nanoseconds for a branch misprediction for the instruction cache.
L2 cache
L2 caches - instruction and data (shared) - vary in size but can range from 256 kilobytes to 8 megabytes. L2 cache access time is around 5-7 nanoseconds.
L3 Cache
L3 is a shared cache. L3 caches can vary in size from 32 to 64 megabytes. The L3 cache is the largest, but also the slowest, with access times of around 12 nanoseconds. The L3 cache can be on the CPU itself, but there are L1 and L2 caches for each core, while the L3 cache is more of a shared cache for all the cores on the chip.
Main memory
Main memory (primary storage) – this varies in size from 16 to 256 gigabytes. Access times are around 60 nanoseconds.
Disk storage
Disk storage (secondary storage) - This goes up to terabytes in size. Access speeds are around 100 microseconds for solid-state storage and around 300 microseconds for non-solid-state storage.
Access times are given above for imaging, how many times each memory is faster or slower than the other.
Let's define an array with 64 1024 1024 integer elements. In the code below we define two loops, the first iterates and multiplies each element by 4. The second loop iterates and multiplies each element by 16. Take a benchmark for two implementations. Which implementation is faster and how often? The second loop is faster in 1/16 of the time, isn't it?
@State(Scope.Thread)
@BenchmarkMode(Mode.AverageTime)
@Warmup(iterations = 2, time = 1, timeUnit = TimeUnit.SECONDS)
@Measurement(iterations = 2, time = 1, timeUnit = TimeUnit.SECONDS)
@Fork(2)
@OutputTimeUnit(TimeUnit.MILLISECONDS)
public class CpuCache {
    private static final int ARRAY_SIZE = 64 * 1024 * 1024;
    public int[] array;

    @Setup(Level.Iteration)
    public void setUp() {
        array = new int[ARRAY_SIZE];
        Arrays.fill(array, 1);
    }

    @Benchmark
    public void baseline() {

    }

    @Benchmark
    public void accessfieldby_16(Blackhole bh) {
        for (int i = 0, n = array.length; i < n; i+=16) {
            array[i] *= 3;
        }
    }

    @Benchmark
    public void accessfieldby_1(Blackhole bh) {
        for (int i = 0, n = array.length; i < n; i++) {
            array[i] *= 3;
        }
    }
}
Consider the result of the benchmarks.
Benchmark                  Mode  Cnt   Score    Error  Units
CpuCache.accessfieldby_1   avgt    4  18.675 ±  2.091  ms/op
CpuCache.accessfieldby_16  avgt    4  18.702 ±  0.447  ms/op
CpuCache.baseline          avgt    4  ≈ 10⁻⁶           ms/op
Why does it take the same time to multiply every 16th element round as it does to multiply every single element? The second loop only does a fraction of the work, so how is it possible for the first loop to run at the same speed? The answer lies in how the CPU uses the cache and why we use every 16th element. On my laptop, I got an L1 data and instruction cache of 32 kB per core, with a cache line size of 64 bytes.
kyryl-rybkin@pc:~$ lscpu | grep "cache"
L1d cache:                       192 KiB (6 instances)
L1i cache:                       192 KiB (6 instances)
kyryl-rybkin@pc:~$ getconf -a | grep CACHE
LEVEL1_ICACHE_SIZE                 32768
LEVEL1_ICACHE_ASSOC
LEVEL1_ICACHE_LINESIZE             64
LEVEL1_DCACHE_SIZE                 32768
LEVEL1_DCACHE_ASSOC                8
LEVEL1_DCACHE_LINESIZE             64
If we iterate over the data sequentially or per cache line, we can get roughly the same number of operations per second because L1 is closer to the core and fast enough.
Data size and L1, L2, and L3 caches
Let's consider whether the size of a data structure affects the runtime performance of software. We can do a little experiment. First, define the size of the array as params for the benchmark. Second, define a benchmark loop that could evaluate over the array and do the trivial operations, e.g. multiply by 3 on each cache line.
@State(Scope.Thread)
@BenchmarkMode(Mode.AverageTime)
@Warmup(iterations = 5, time = 1, timeUnit = TimeUnit.SECONDS)
@Measurement(iterations = 5, time = 1, timeUnit = TimeUnit.SECONDS)
@OutputTimeUnit(TimeUnit.NANOSECONDS)
public class ArraySize {
    private static final int ARRAY_CONTENT = 777;
    @Param({"1024", "2048", "4096", "8192", "16384", "32768", "65536", "131072", "262144", "524288", "1048576", "2097152", "4194304", "8388608", "16777216", "33554432", "67108864", "134217728", "268435456", "536870912"})
    public int size;
    public int[] array;
    public int counter;
    public int mask;

    @Setup(Level.Iteration)
    public void setUp() {
        final int elements = size / 4;
        final int indexes = elements / 16;
        mask = indexes - 1;
        array = new int[elements];
        Arrays.fill(array, ARRAY_CONTENT);
    }

    @Benchmark
    public void benchLoop() {
        array[16 * counter] *= 3;
        counter = (counter + 1) & mask;
    }
}
Benchmark               (size)  Mode  Cnt  Score   Error  Units
ArraySize.benchLoop       1024  avgt   25  1.296 ± 0.001  ns/op
ArraySize.benchLoop       4096  avgt   25  1.303 ± 0.009  ns/op
ArraySize.benchLoop       8192  avgt   25  1.297 ± 0.021  ns/op
ArraySize.benchLoop      32768  avgt   25  1.357 ± 0.058  ns/op
ArraySize.benchLoop      49152  avgt   25  1.345 ± 0.036  ns/op
ArraySize.benchLoop      65536  avgt   25  1.417 ± 0.039  ns/op
ArraySize.benchLoop      98304  avgt   25  1.320 ± 0.026  ns/op
ArraySize.benchLoop     131072  avgt   25  1.415 ± 0.019  ns/op
ArraySize.benchLoop     196608  avgt   25  1.415 ± 0.037  ns/op
ArraySize.benchLoop     229376  avgt   25  1.398 ± 0.027  ns/op
ArraySize.benchLoop     262144  avgt   25  1.542 ± 0.029  ns/op
ArraySize.benchLoop     393216  avgt   25  1.411 ± 0.037  ns/op
ArraySize.benchLoop     524288  avgt   25  1.610 ± 0.034  ns/op
ArraySize.benchLoop    1048576  avgt   25  1.636 ± 0.025  ns/op
ArraySize.benchLoop    1572864  avgt   25  1.668 ± 0.063  ns/op
ArraySize.benchLoop    2097152  avgt   25  1.920 ± 0.038  ns/op
ArraySize.benchLoop    6291456  avgt   25  1.917 ± 0.036  ns/op
ArraySize.benchLoop    8388608  avgt   25  3.327 ± 0.109  ns/op
ArraySize.benchLoop   10485760  avgt   25  1.905 ± 0.078  ns/op
ArraySize.benchLoop   16777216  avgt   25  4.451 ± 0.287  ns/op
ArraySize.benchLoop   33554432  avgt   25  4.932 ± 0.030  ns/op
ArraySize.benchLoop   67108864  avgt   25  5.125 ± 0.041  ns/op
ArraySize.benchLoop  134217728  avgt   25  5.177 ± 0.020  ns/op
ArraySize.benchLoop  268435456  avgt   25  5.201 ± 0.033  ns/op
ArraySize.benchLoop  536870912  avgt   25  5.320 ± 0.274  ns/op
As we know, accessing a single element takes a constant time in Big O notation, O(1). But on the hardware we get a different cache level which has a different access time for stored data. If we iterate over the L1-L3 cache, it takes less than 2 ns/op to operate. But when we load data from main memory, it takes more time. If you look closely, you can even see the small jump between L1, L2 and L3 cache, with the access time increasing from L1 to L3 cache size.
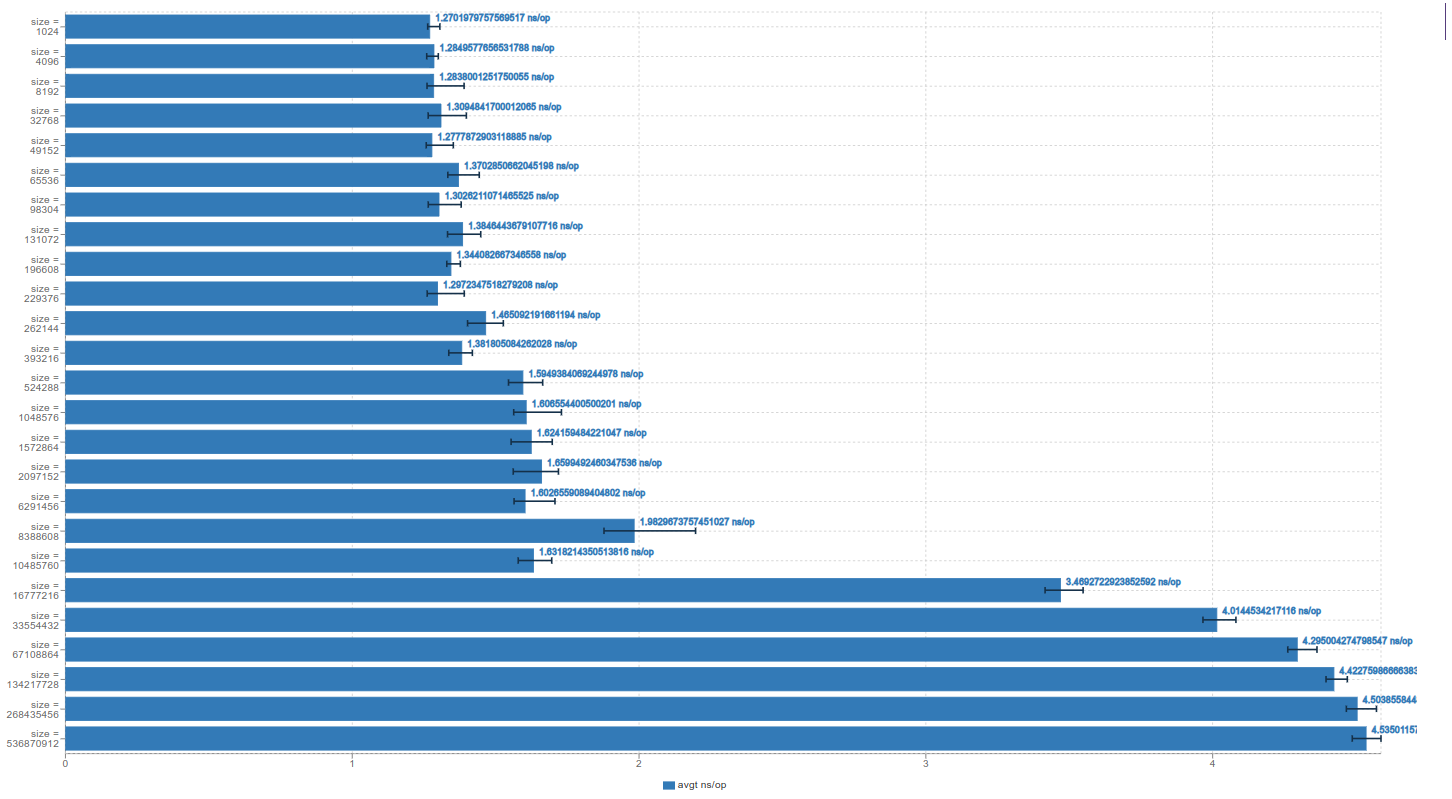
Size matters. The smaller the amount of data you use for a particular data structure, the more likely it is to fit in the cache, which can lead to significantly better performance.
Data access patterns. Random or Sequential memory access
Does the order in which the data is accessed have an impact? Instead of just running sequentially through the array, let's create a second array to store the order in which the data is accessed. In the first case, access the array sequentially as before, and then access it in any order and measure the difference. Take a look at the listing below.
@State(Scope.Thread)
@BenchmarkMode(Mode.AverageTime)
@Warmup(iterations = 5, time = 1)
@Measurement(iterations = 5, time = 1)
@OutputTimeUnit(TimeUnit.NANOSECONDS)
public class RandomAccess {

    private static final int ARRAY_CONTENT = 777;
    @Param({"1024", "2048", "4096", "8192", "16384", "32768", "65536", "131072", "262144", "524288", "1048576", "2097152", "4194304", "8388608", "16777216", "33554432", "67108864", "134217728", "268435456", "536870912"})
    public int size;
    public int[] array;
    public int seqcounter;
    public int randomcounter;
    public int mask;
    public int[] rndIndex;
    public int[] seqIndex;

    @Setup(Level.Iteration)
    public void setUp() {
        final int elements = size / 4;
        final int indexes = elements / 16;
        mask = indexes - 1;
        array = new int[elements];
        Arrays.fill(array, ARRAY_CONTENT);
        rndIndex = new int[indexes];
        seqIndex = new int[indexes];
        seqcounter = 0;
        randomcounter = 0;
        final List<Integer> list = new ArrayList<>(indexes);
        for (int i=0; i<indexes; i++) {
            list.add(16 * i);
        }
        Collections.shuffle(list);
        for (int i=0; i<indexes; i++) {
            rndIndex[i] = list.get(i);
        }

        for (int i = 0; i < indexes; i++) {
            seqIndex[i] = i*16;
        }
    }

    @Benchmark
    public void randomAccess(Blackhole bh) {
        array[rndIndex[randomcounter]] *= 3;
        randomcounter = (randomcounter + 1) & mask;
    }

    @Benchmark
    public void seqAccess(Blackhole bh) {
        array[seqIndex[seqcounter]] *= 3;
        seqcounter = (seqcounter + 1) & mask;
    }
}
Benchmark                     (size)  Mode  Cnt   Score   Error  Units
RandomAccess.randomAccess       1024  avgt   25   1.511 ± 0.146  ns/op
RandomAccess.randomAccess       2048  avgt   25   1.472 ± 0.034  ns/op
RandomAccess.randomAccess       4096  avgt   25   1.448 ± 0.063  ns/op
RandomAccess.randomAccess       8192  avgt   25   1.429 ± 0.010  ns/op
RandomAccess.randomAccess      16384  avgt   25   1.477 ± 0.028  ns/op
RandomAccess.randomAccess      32768  avgt   25   1.588 ± 0.031  ns/op
RandomAccess.randomAccess      65536  avgt   25   1.671 ± 0.108  ns/op
RandomAccess.randomAccess     131072  avgt   25   1.736 ± 0.112  ns/op
RandomAccess.randomAccess     262144  avgt   25   2.256 ± 0.047  ns/op
RandomAccess.randomAccess     524288  avgt   25   2.559 ± 0.104  ns/op
RandomAccess.randomAccess    1048576  avgt   25   2.708 ± 0.084  ns/op
RandomAccess.randomAccess    2097152  avgt   25   2.746 ± 0.051  ns/op
RandomAccess.randomAccess    4194304  avgt   25   2.762 ± 0.089  ns/op
RandomAccess.randomAccess    8388608  avgt   25   5.918 ± 1.037  ns/op
RandomAccess.randomAccess   16777216  avgt   25  13.802 ± 0.815  ns/op
RandomAccess.randomAccess   33554432  avgt   25  14.856 ± 0.449  ns/op
RandomAccess.randomAccess   67108864  avgt   25  15.767 ± 0.647  ns/op
RandomAccess.randomAccess  134217728  avgt   25  16.016 ± 0.488  ns/op
RandomAccess.randomAccess  268435456  avgt   25  16.138 ± 0.322  ns/op
RandomAccess.randomAccess  536870912  avgt   25  16.286 ± 0.264  ns/op
RandomAccess.seqAccess          1024  avgt   25   1.480 ± 0.026  ns/op
RandomAccess.seqAccess          2048  avgt   25   1.462 ± 0.024  ns/op
RandomAccess.seqAccess          4096  avgt   25   1.449 ± 0.018  ns/op
RandomAccess.seqAccess          8192  avgt   25   1.452 ± 0.041  ns/op
RandomAccess.seqAccess         16384  avgt   25   1.518 ± 0.113  ns/op
RandomAccess.seqAccess         32768  avgt   25   1.521 ± 0.011  ns/op
RandomAccess.seqAccess         65536  avgt   25   1.642 ± 0.054  ns/op
RandomAccess.seqAccess        131072  avgt   25   1.664 ± 0.044  ns/op
RandomAccess.seqAccess        262144  avgt   25   1.785 ± 0.030  ns/op
RandomAccess.seqAccess        524288  avgt   25   1.928 ± 0.041  ns/op
RandomAccess.seqAccess       1048576  avgt   25   1.989 ± 0.074  ns/op
RandomAccess.seqAccess       2097152  avgt   25   2.029 ± 0.100  ns/op
RandomAccess.seqAccess       4194304  avgt   25   2.077 ± 0.097  ns/op
RandomAccess.seqAccess       8388608  avgt   25   2.827 ± 0.328  ns/op
RandomAccess.seqAccess      16777216  avgt   25   5.133 ± 0.480  ns/op
RandomAccess.seqAccess      33554432  avgt   25   5.680 ± 0.352  ns/op
RandomAccess.seqAccess      67108864  avgt   25   5.599 ± 0.374  ns/op
RandomAccess.seqAccess     134217728  avgt   25   5.353 ± 0.441  ns/op
RandomAccess.seqAccess     268435456  avgt   25   5.236 ± 0.330  ns/op
RandomAccess.seqAccess     536870912  avgt   25   5.053 ± 0.145  ns/op
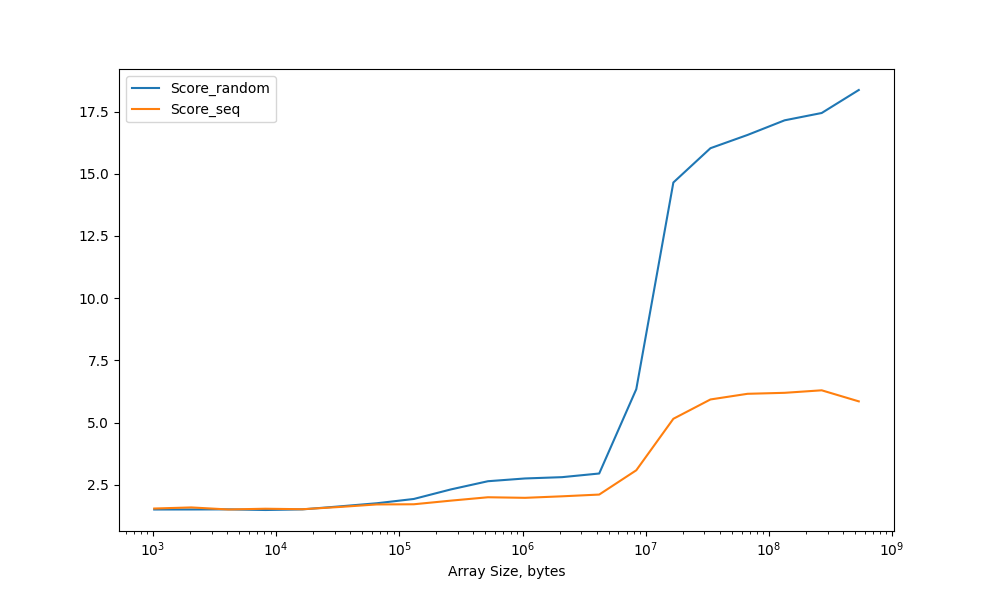
As a result, both curves show almost the same access time with caches L1, L2 and L3.
The performance of the sequential access scheme is noticeably higher than in the random access scheme, especially noticeable when loading data from memory.
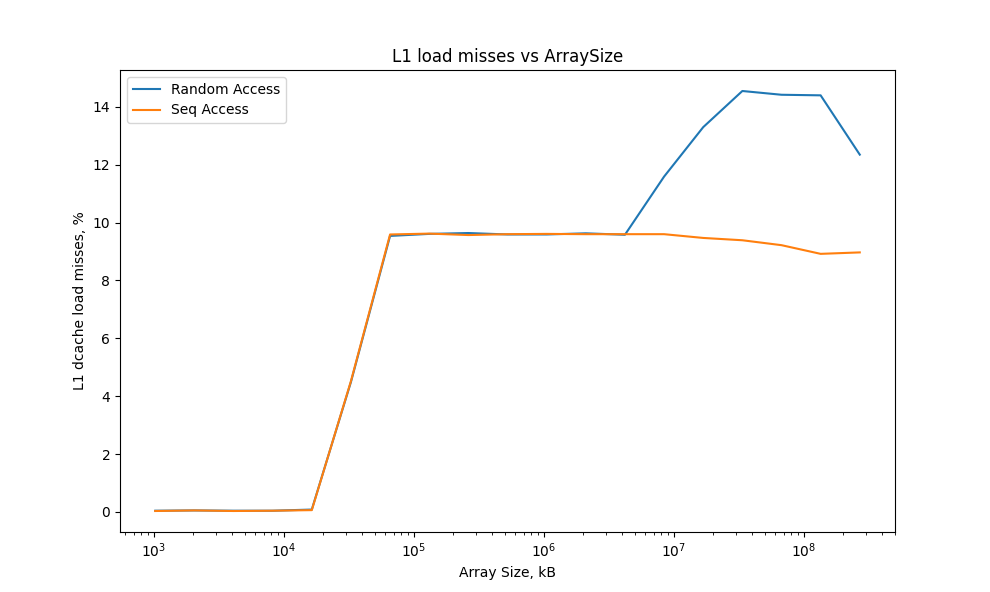
The ratio between successful loads and cache misses is very different for type data accesses. When the array is accessed sequentially, only about 6% of all memory loads result in cache misses. When data is accessed randomly, the number of cache misses increases. The high number of cache misses is quite expected, since the array does not fit in the cache and you have to load everything from RAM. But why are there almost no cache misses when accessing the array sequentially? Because there is a prefetcher that loads the data of the next cache line when interacting with the current line. That's why we can observe a low level of cache misses when sequentially accessing a small-sized array.
Performance penalty with False Sharing
@State(Scope.Group)
@BenchmarkMode(Mode.Throughput)
@OutputTimeUnit(TimeUnit.MICROSECONDS)
@Warmup(iterations = 5, time = 1, timeUnit = TimeUnit.SECONDS)
@Measurement(iterations = 5, time = 1, timeUnit = TimeUnit.SECONDS)
@Fork(2)
@Threads(2)
public class FalseSharing {
    public final int[] array = new int[17];

    @Benchmark
    @Group("near")
    @GroupThreads(1)
    public void modifyNearA() {
        array[0]++;
    }
    @Benchmark
    @Group("near")
    @GroupThreads(1)
    public void modifyNearB() {
        array[1]++;
    }
    @Benchmark
    @Group("far")
    @GroupThreads(1)
    public void modifyFarA() {
        array[0]++;
    }
    @Benchmark
    @Group("far")
    @GroupThreads(1)
    public void modifyFarB() {
        array[16]++;
    }
}
Benchmark                       Mode  Cnt     Score     Error   Units
FalseSharing.baseline          thrpt   25  1648.375 ± 531.950  ops/us
FalseSharing.baseline:reader   thrpt   25   801.301 ± 522.013  ops/us
FalseSharing.baseline:writer   thrpt   25   847.073 ±  14.666  ops/us
FalseSharing.far               thrpt   25   536.287 ±  66.998  ops/us
FalseSharing.far:modifyFarA    thrpt   25   372.084 ±  45.881  ops/us
FalseSharing.far:modifyFarB    thrpt   25   164.203 ±  52.845  ops/us
FalseSharing.near              thrpt   25   407.426 ±  48.644  ops/us
FalseSharing.near:modifyNearA  thrpt   25   230.663 ±  43.739  ops/us
FalseSharing.near:modifyNearB  thrpt   25   176.763 ±  41.006  ops/us